India's Wealth Status: Is It a Poor or Rich Nation?
 Oct, 9 2025
India's Economic Status Comparison Tool
This tool compares key economic indicators between India and other major economies to illustrate how India's total GDP differs from its per-capita income and poverty levels.
Total GDP
$3.73 Trillion
India's 5th largest globally
GDP per Capita (PPP)
$2,400
Lower-middle income bracket
Poverty Rate
21%
300 million people below poverty line
Human Development Index
0.633
Medium human development
Comparative Analysis
| Country | GDP (Trillion USD) | GDP per Capita (PPP) | Poverty Rate (%) | HDI (2023) |
|---|---|---|---|---|
| India | 3.73 | $2,400 | 21 | 0.633 |
| China | 19.9 | $12,500 | 5.5 | 0.771 |
| United States | 26.9 | $70,200 | 11.4 | 0.938 |
| Germany | 4.3 | $55,600 | 9.2 | 0.942 |
Key Insights
- Total GDP: India ranks 5th globally but per capita income is much lower.
- Per Capita Income: Reflects average living standards; India is in lower-middle income bracket.
- Poverty Rate: Around 21% of population lives below official poverty line.
- HDI: India ranks 131st globally, indicating room for improvement in human development.
Understanding the Numbers
India's large total GDP is driven by its massive population (~1.4 billion). While this makes it one of the world's biggest economies, the per-capita income shows that average citizens have relatively modest economic conditions.
Despite progress in reducing poverty from over 45% in early 2000s, a large portion of the population still faces challenges. The Human Development Index further illustrates that economic output alone does not guarantee widespread well-being.
Conclusion
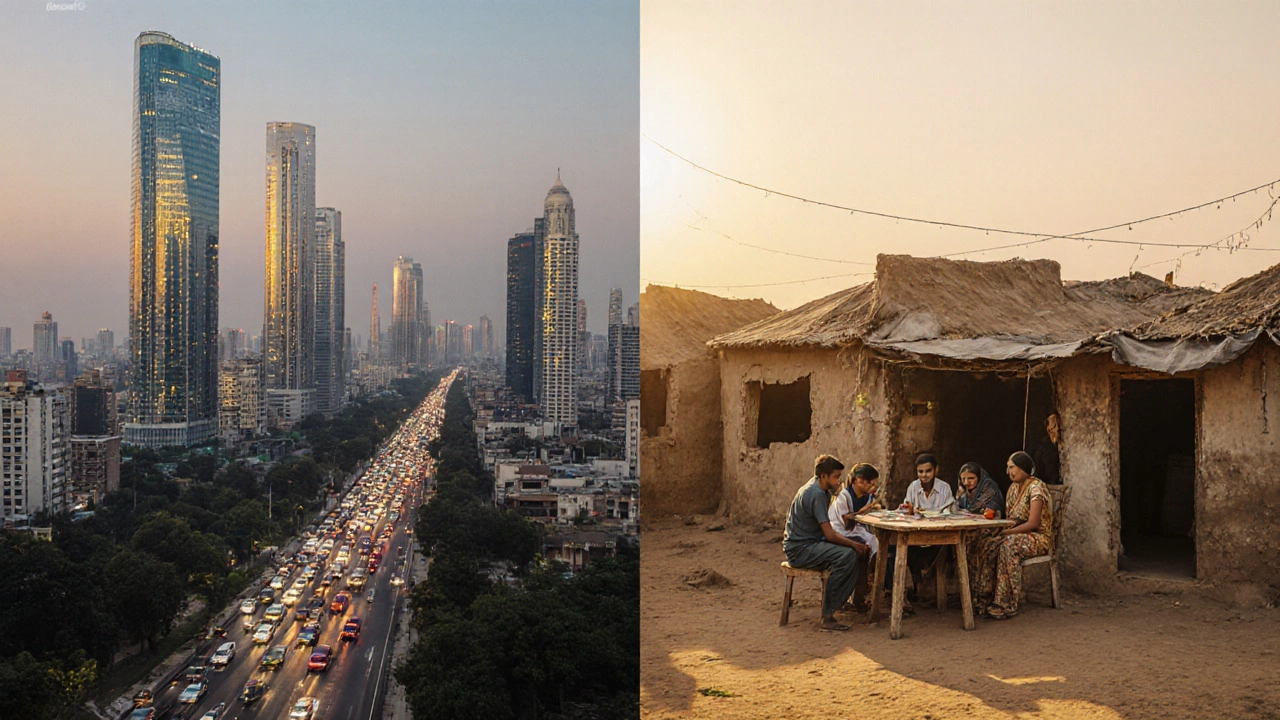
India is a mixed economy: it has a large total GDP and a growing middle class, but also significant poverty and inequality. It's classified as a developing country with high growth potential and a demographic dividend.
Key Takeaways
- India ranks among the world’s largest economies by total GDP, but its per‑capita income remains low.
- More than 20% of the population lives below the national poverty line, while a fast‑growing middle class fuels consumption.
- Human Development Index (HDI) places India in the medium‑human‑development category, far behind high‑income nations.
- Regional gaps are stark: urban areas enjoy far higher incomes than rural regions.
- Future projections suggest India could become a $5‑trillion economy by 2030, yet challenges in inequality and infrastructure must be addressed.
When people ask "Is India a poor or rich country?", they’re really trying to reconcile two very different pictures. On one hand, India is the seventh‑largest economy in the world by nominal GDP, home to over 1.4billion people and a rapidly expanding technology sector. On the other hand, GDP per capita measures the average economic output per person, currently around $2,400 (2024 PPP), which puts India in the lower‑middle income bracket. Add to that a poverty rate of roughly 21% of the population living below the official poverty line, and the picture becomes more nuanced.
Understanding why these numbers coexist requires looking beyond headline figures. The Human Development Index combines life expectancy, education, and per‑capita income into a single metric; India scores 0.633 in 2023, ranking 131st out of 191 countries. International bodies like the World Bank provide data on macro‑economic indicators and poverty assessments for India and the International Monetary Fund offers forecasts that suggest India will remain an emerging market with high growth potential. All these entities help piece together the answer.
Understanding Economic Richness vs. Poverty
Economic richness isn’t just about the size of the pie; it’s also about how the pie is sliced. A country can have a massive total GDP but still leave a large share of its citizens with low incomes. In India’s case, the massive domestic market and a tech‑driven export sector create a substantial aggregate economic output. However, the per‑capita share of that output is diluted by the sheer size of the population.
Two concepts are crucial:
- Total GDP - the sum of all goods and services produced in a year.
- GNI per capita - gross national income divided by the population, a better proxy for average living standards.
When you compare these numbers with those of high‑income nations, the disparity becomes obvious.
How India’s Total GDP Positions It Globally
According to the latest World Bank figures, India’s nominal GDP reached $3.73trillion in 2024, making it the world’s 5th largest economy. That sounds impressive, but it reflects the size of the market rather than the average wealth of its citizens.
Key points:
- India contributes about 7.5% of global GDP.
- Its growth rate averaged 6.8% annually over the past five years, outpacing many developed economies.
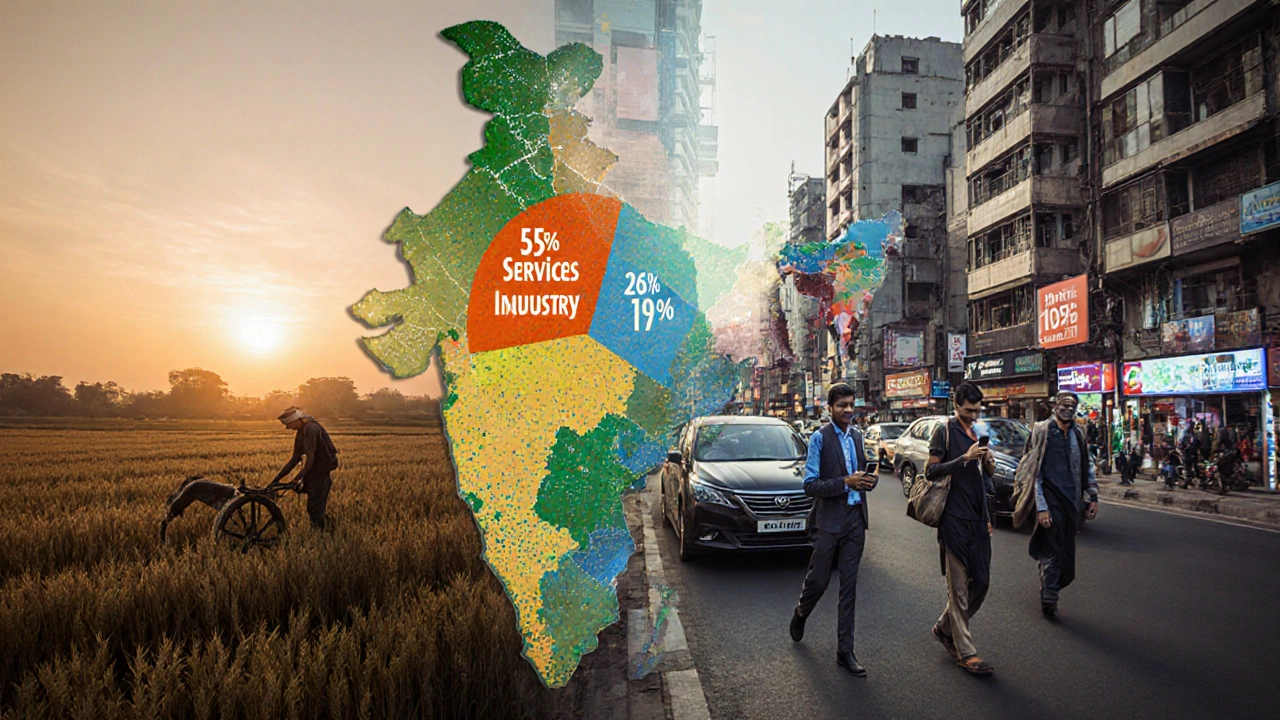
- Sectoral composition: services (≈55%), industry (≈26%), agriculture (≈19%).
The services sector, especially IT services, finance, and telecommunications, drives high‑value export earnings. Yet those high‑value activities employ a relatively small, highly skilled segment of the labor force, leaving the majority in lower‑paid agriculture or informal jobs.
Per‑Capita Income and What It Reveals About Living Standards
India’s GNI per capita was $2,400 (PPP) in 2023, placing it in the lower‑middle‑income group according to the World Bank classification. By contrast, the United States sits above $70,000, Germany around $55,000, and even neighboring China exceeds $12,000.
Why does this matter? Per‑capita figures are closely linked to consumption ability, health outcomes, and education access. In India, the average household income translates to limited discretionary spending, especially in rural areas where over 65% of the population still lives.
Poverty Rate and Inequality: The Other Side of the Coin
The official poverty line, set by the Indian government at around ₹1,000 per day for a family of four (2023), still leaves roughly 21% of Indians below it. That’s about 300million people. While the number has fallen sharply from over 45% in the early 2000s, the absolute count remains huge because of population growth.
Income inequality is captured by the Gini coefficient, which India currently rates at 0.35-0.38. This indicates moderate inequality compared with some Latin American nations but higher than many East Asian economies.
Two trends drive the persistence of poverty:
- Limited access to quality education and vocational training in rural pockets.
- Inadequate social safety nets and uneven implementation of public distribution systems.
Human Development Index and Social Indicators
The Human Development Index combines life expectancy, mean years of schooling, and GNI per capita; India's 2023 value of 0.633 places it in the medium‑human‑development category. For perspective:
- Life expectancy: 70.8years (vs. 78.8years in the EU).
- Mean years of schooling: 6.5years (vs. 12.3years in Finland).
- Literacy rate: 77% (with a significant gender gap).
These social metrics highlight that economic output alone doesn’t translate into broad-based well‑being.

Regional Disparities: Rural vs. Urban Wealth Gap
Urban centers like Mumbai, Delhi, Bengaluru, and Hyderabad enjoy per‑capita incomes 3‑4 times the national average. In contrast, many tribal and agrarian districts in states such as Bihar, Uttar Pradesh, and Madhya Pradesh lag far behind.
Key statistics:
- Urban per‑capita income (2023): ~$4,900 PPP.
- Rural per‑capita income (2023): ~$1,800 PPP.
- Urbanization rate: 35% of the population lives in cities, projected to reach 45% by 2035.
This gap fuels migration pressures, creates housing shortages in metros, and strains urban infrastructure.
Trends and Future Outlook: Moving Toward a Higher‑Income Economy
Several forces suggest a shift toward greater prosperity:
- Demographic dividend: Over 600million people are aged 15‑34, providing a large labor pool.
- Digital adoption: More than 800million internet users drive e‑commerce and fintech growth.
- Policy reforms: Goods and Services Tax (GST), Make-in-India, and agricultural reforms aim to improve efficiency.
International projections from the International Monetary Fund forecast India’s GDP to reach $5.1trillion by 2030, potentially moving it into the top‑four global economies if growth sustains.
However, challenges remain:
- Infrastructure bottlenecks - power, transport, and logistics still lag.
- Education quality - need to upskill the massive youth cohort.
- Environmental concerns - water scarcity and air pollution could hamper productivity.
In short, India is a mix of wealth and poverty: a giant economy with a sizable middle class, yet a significant share of the population still struggles for basic necessities.
Comparison Table: India vs. Selected Economies (2024)
| Country | Nominal GDP (trillion USD) | GDP per Capita (PPP, USD) | Poverty Rate (%) | HDI (2023) |
|---|---|---|---|---|
| India | 3.73 | 2,400 | 21 | 0.633 |
| China | 19.9 | 12,500 | 5.5 | 0.771 |
| United States | 26.9 | 70,200 | 11.4 | 0.938 |
| Germany | 4.3 | 55,600 | 9.2 | 0.942 |
Frequently Asked Questions
Is India considered a developing or developed country?
India is classified as a developing (or lower‑middle‑income) country by the World Bank due to its per‑capita income, HDI ranking, and large share of the population living below the poverty line, despite its large total GDP.
How does India’s poverty rate compare to other major economies?
India’s 21% poverty rate is higher than China (≈5.5%), the United States (≈11%), and most European nations (generally under 10%). However, it has fallen dramatically from over 45% two decades ago.
Will India become a high‑income country soon?
Projections suggest India could cross the $5‑trillion GDP mark by 2030, but reaching high‑income status (per‑capita income above $12,000) likely requires sustained growth, major reforms in education, health, and infrastructure over the next 15‑20 years.
What role does the middle class play in India’s economy?
India’s middle class-estimated at 300-350million people-drives consumption, fuels demand for housing, automobiles, and digital services, and acts as a catalyst for economic diversification beyond agriculture.
How reliable are the economic statistics for India?
Data from the World Bank, IMF, and India’s Ministry of Statistics are widely used, but informal sector activity and regional disparities can cause under‑reporting in certain areas, especially in rural poverty measurements.